Trace logic with the Virtual Debugger
The Virtual Debugger lets you step through a function's logic by hand, without running the code — ideal when you can't run it, can't reproduce a bug in a live debugger, or just want to reason methodically about the control flow. You make the branch decisions; it records the path. (For the whole function's branch structure at a glance, open its control-flow graph instead — the Virtual Debugger is for walking one path at a time.)
Start it
With a function selected (find one fast), right-click →
Start Virtual Debugger
(Ctrl+Shift+B), or use the
debug toolbar. (It's offered only for debuggable functions; if none is selected you'll be prompted to
pick one.) The window opens as Virtual Debugger for
Step through
Drive it with the toolbar buttons or keyboard:
| Action | Key |
|---|---|
| Previous statement | Up |
| Next statement | Down |
| Enter block | Right |
| Enter function | Enter |
| Exit function | Esc |
At decision points you choose the branch; the debugger tracks the Path you took. Use Copy to Clipboard to hand that path to whoever's fixing the bug.
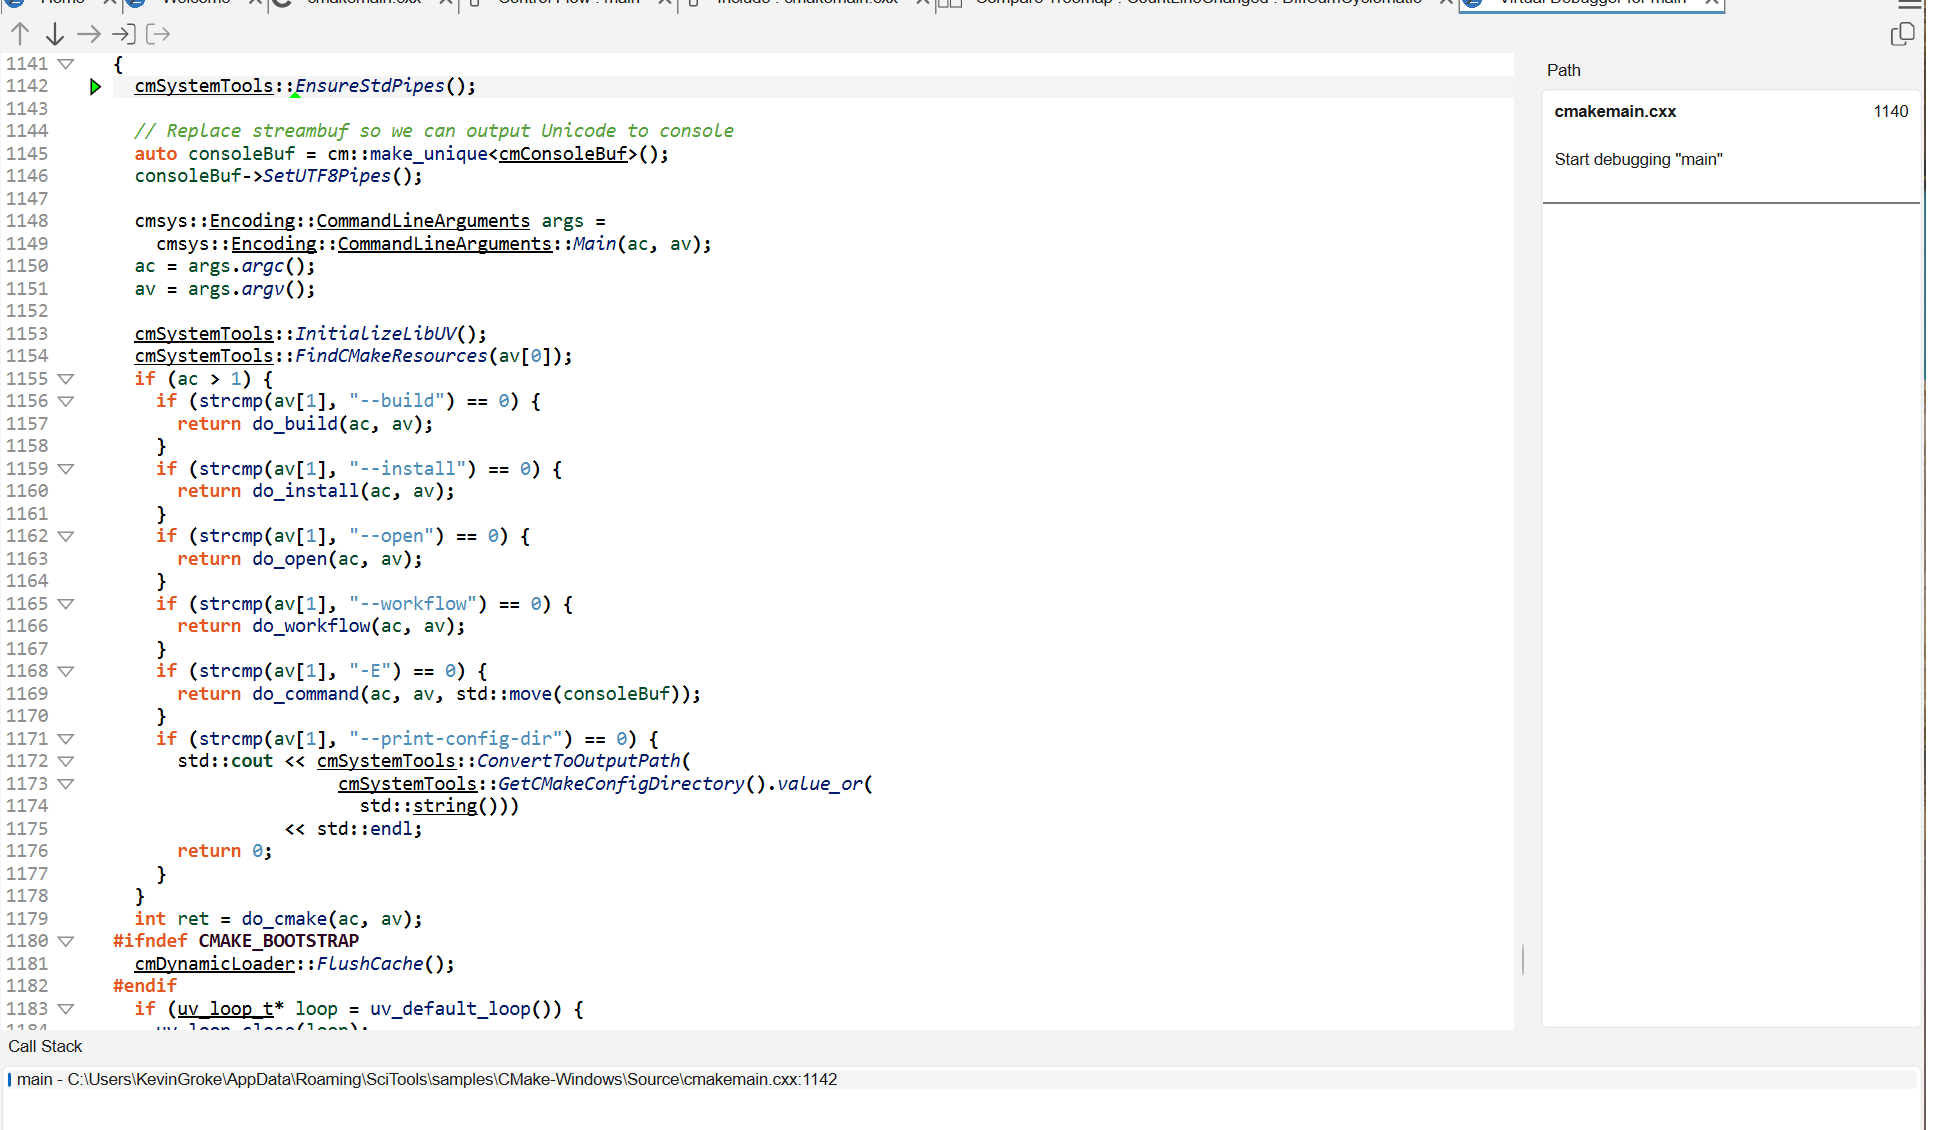
main — the arrow marks the current statement,
the Path panel (right) records every step you take, and the
Call Stack (bottom) tracks where you are.To keep a function's structure and enclosing scope in view while you read rather than step, use Contextual information and scope.